Mermaid Charts: Enhancing Data Visualization
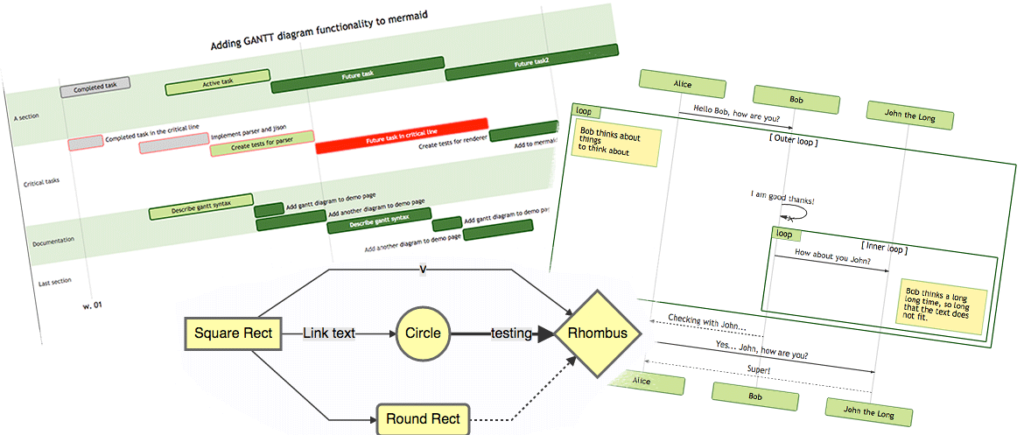
Mermaid charts are a unique and efficient way to visualize data using text-based notation. These charts can be crafted using data in formats like JSON, YAML, and other text-based structures. The language used in Mermaid charts is similar to Markdown, allowing for an intuitive and easy-to-learn approach to data visualization

Elevating Database Diagrams
Mermaid charts have revolutionized the way database diagrams are visualized. By using a text-based approach, these charts simplify the representation of complex database structures. This method makes it easier to comprehend relationships between different data elements, crucial for database design and management. The ability to convert text-based diagrams into visually appealing charts enhances both understanding and communication among team members.
Streamlining Process Diagrams
In the realm of process diagrams, Mermaid charts stand out for their simplicity and effectiveness. They enable the clear depiction of workflow processes, illustrating each step and its interconnections. This clarity is particularly beneficial in identifying bottlenecks and optimizing workflows. The intuitive nature of Mermaid charts makes them an ideal tool for both professionals and beginners in process management.
UML Diagrams and Mermaid Charts: A Perfect Match
For software engineers and system architects, UML diagrams are a staple. Mermaid charts bring a new level of efficiency to creating these diagrams. With their text-based format, they facilitate quick modifications and updates, which is essential in the dynamic environment of software development. The ability to visualize complex system architectures through these charts aids in better planning and implementation of software projects.
Software Development Enhanced by Mermaid Charts
In software development, Mermaid charts prove to be invaluable. They help in visualizing code structures, dependencies, and workflows. This visualization is critical in understanding how different parts of the software interact, leading to more efficient and error-free coding. The charts’ simplicity also makes them an excellent tool for documentation, aiding in the onboarding of new team members and in maintaining clarity in the development process.
Data Analysis Made Clearer with Mermaid Charts
In data analysis, the ability to visualize data patterns and results is key. Mermaid charts offer a unique way to represent these analyses, making complex data more accessible and understandable. They are particularly useful in presenting findings to stakeholders who may not be well-versed in technical data interpretation, thereby bridging the gap between data analysts and decision-makers.
Optimizing Business Process Management
In the context of business process management, Mermaid charts provide a clear visualization of business processes, helping managers to identify inefficiencies and areas for improvement. These charts are instrumental in planning and implementing process changes, ensuring that every stakeholder understands the workflow and their role within it. The ease of creating and updating these charts makes them an ideal tool for dynamic business environments where processes are continually evolving.
I’ve recently started using Mermaid Gantt charts for task management, finding them to be more straightforward and adaptable than Microsoft Project. Managing tasks with these charts has proven to be a simpler and more flexible approach for me.